
The Same Room
On Fattouh and Economou’s OIES paper, and the oil market regime that ended on 28 February.

Strip the war out of the headlines for a moment.
Look at what the inventory data did in March.
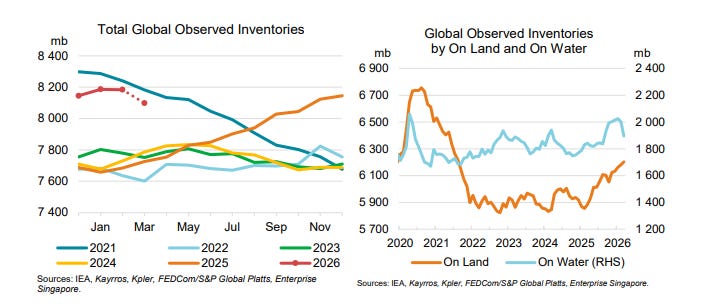
Global oil-on-sea inventory fell by 100 million barrels in a single month.
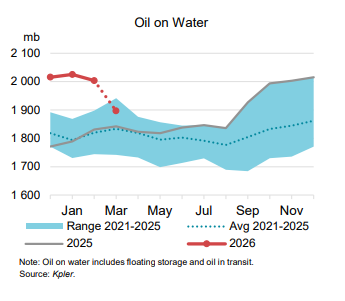
Not unusual on its own — supply shocks draw inventory.
But the regional decomposition moved in two directions that were not supposed to coexist. Floating storage in the Middle East grew by 110 million barrels — Iranian and other Gulf cargoes piling up on tankers because they could not move.
Strip out the Middle East stranded barrels, and the rest of the world drew inventory at over 200 million barrels in a single month.
That is the chart you should have circled.
A 200-million-barrel monthly draw outside the Middle East has no precedent.
Not in 1973.
Not in 1979.
Not in 1990.
Not in the COVID rebound.
The closest analogue is the cumulative draw across the early months of 2022 after the Russian invasion — and that took quarters, not weeks.
This is what an oil market looks like when its largest source of physical supply has been geographically separated from its consumers. Inventory stranded on the wrong side of a chokepoint. Demand drawing down whatever it can reach. Two opposite movements at the same time, because the system has been cut into halves that cannot communicate.
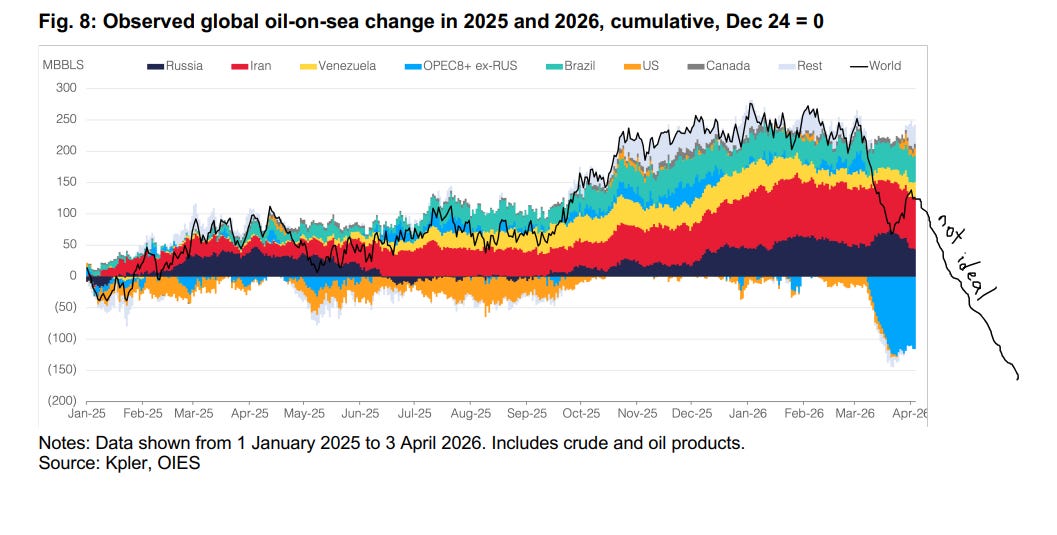
The chart is figure 8 in The Anatomy of the Strait of Hormuz Oil Shock — Bassam Fattouh and Andreas Economou, OIES Energy Insight 181, late April.
Twenty-three pages.
Twenty-two figures.
Two tables.
The cleanest piece of empirical writing anyone is going to produce about the regime change in the oil market while the regime change is still happening.
It is the chart, more than any other in the paper, that shows the model of the oil market I was taught no longer works.
That is what this article is about.
What the desk taught you, and what the desk got wrong
The first thing they teach you on a trading desk is that oil shocks are temporary.
Production gets disrupted.
Prices spike.
Demand bends, supply finds a workaround, the curve flattens, and within a few quarters the system has rebuilt the buffer it consumed.
The 1973 embargo cleared in six months.
The 1979 revolution shock cleared in eighteen.
The 1990 invasion of Kuwait — the closest historical analogue to what is happening now — had Saudi spare capacity online within weeks.
Even Abqaiq in September 2019, which took 5.7 mb/d of Saudi production offline through a drone strike Iran almost certainly facilitated, had Aramco back to ten million barrels a day in ten days flat.
The textbook works because of one assumption nobody bothers to write down.
Spare capacity is geographically separable from disruption.
The shock happens somewhere.
The buffer sits somewhere else.
When the shock is in Iraq, Saudi makes up the volume.
When the shock is in Libya, the GCC makes it up.
When Venezuela collapses, the US shale patch absorbs it.
The buffer always lives in a different physical space from the breakage, which is what makes it a buffer at all. A volume of producible barrels that can flow when other barrels cannot.
Look at the OPEC+ spare-capacity map for 2026 and you see the problem.
Saudi Arabia. UAE. Kuwait. Iraq. Iran in some scenarios. Eight, maybe nine million barrels a day of nominal spare.
Approximately all of it sitting in the Gulf.
In the same room as the disruption.
That is what Fattouh and Economou wrote down.
“The existing buffers in the oil system are insufficient to absorb a shock of this magnitude in volumetric terms, particularly because spare capacity, one of the market’s most effective adjustment mechanisms, is unavailable as it is located in the same region as the source of the disruption.”
It is one careful sentence on page two. It is also the obituary for the analytical model that ran the global oil market for the last forty years.
The size of the breakage
Read the headline number twice before believing it.
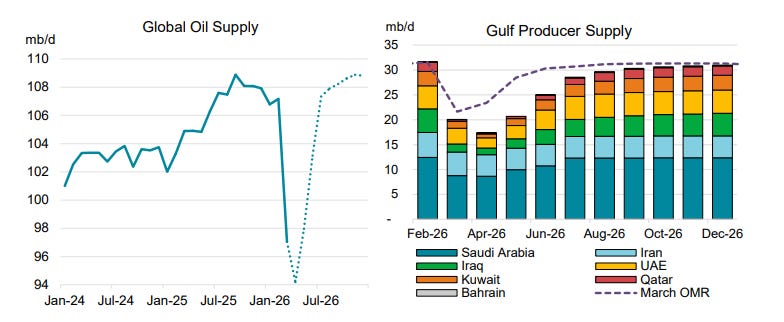
On a total liquids basis including NGLs, the drop is closer to 12.6 mb/d. Cumulative output losses since the start of the war reach approximately 790 million barrels by end-April.
The chart in figure 4 puts the move into historical context.
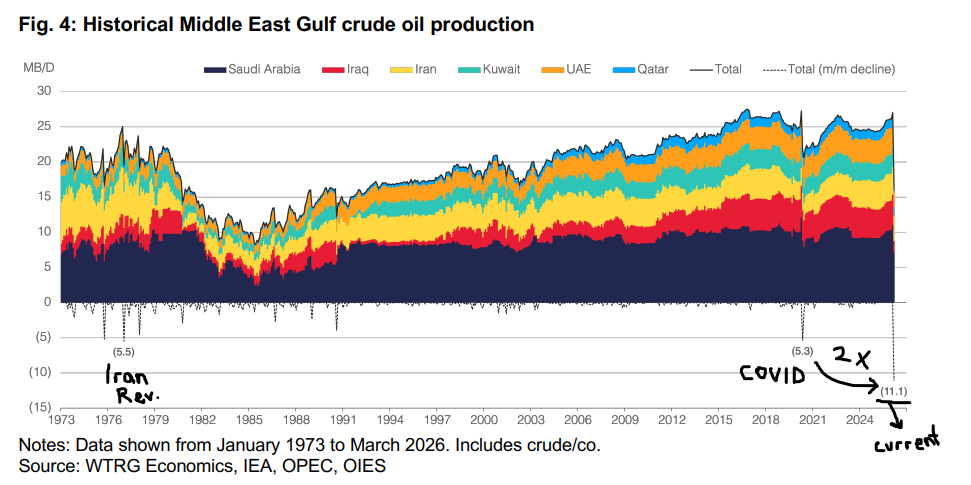
Two earlier troughs are visible.
The 5.5 mb/d collapse in 1979-80 from the Iranian revolution.
The 5.3 mb/d voluntary cut in May 2020 during COVID.
Both episodes that, when they happened, defined the upper bound of what an oil supply shock could look like.
The March 2026 drop is twice as large.
It is not in the same category. It is the largest month-on-month supply disruption in the recorded history of the global oil market.
The country-level decomposition tells you why nobody can replace it.
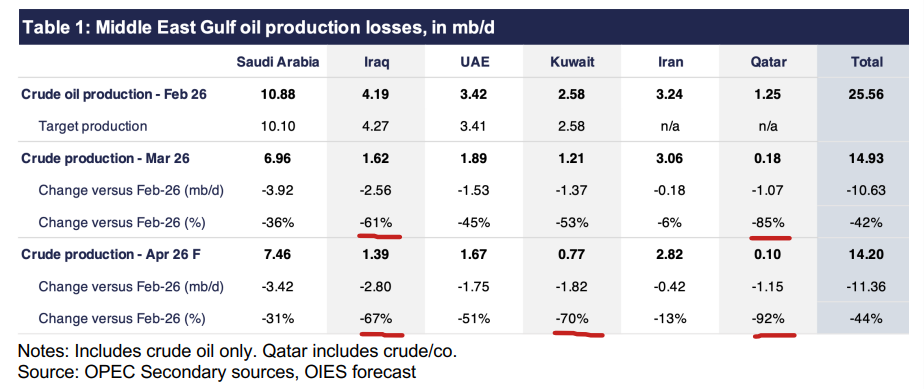
Producers without bypass capacity got hit hardest.
Now compare the loss to the buffers.
The IEA member countries collectively agreed to release 398 million barrels from strategic reserves. About half the cumulative loss to end-April.
The math gets worse when you look inside it. Only 273.5 million barrels of the release is crude. The remaining 125 million barrels is product.
Most of the shut-in production is medium sour.
Most of the SPR release is light sweet.
Most of the demand is in Asia.
Most of the inventory is in OECD storage tanks half a world away from the refineries that need it.
The release is real. The relief is not.
And the recovery profile, which Fattouh and Economou walk through producer by producer, is asymmetric and partly permanent.
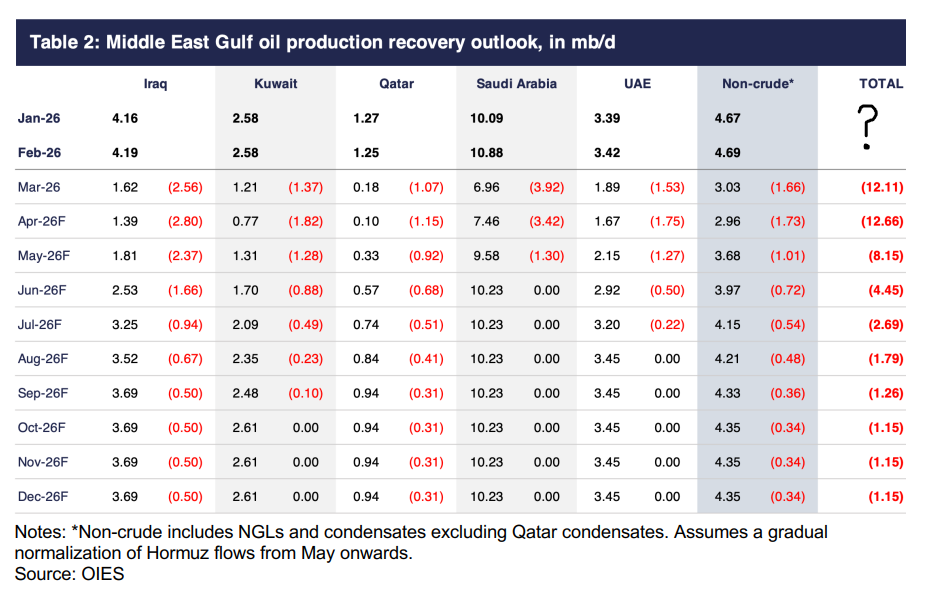
Saudi Arabia recovers fastest because it has done this before — Aramco at Abqaiq in 2019 — and because it has the technical reserves to manage a complex restart.
The UAE comes next.
Qatar and the offshore-onshore processing chains in both the UAE and Qatar carry the highest risk of permanent capacity loss because long shut-ins of complex offshore systems can damage wells, reservoirs, and flowlines in ways that workovers cannot fully reverse.
Iraq is in the worst recovery position. Mature fields, infrastructure constraints, no bypass. Iraqi refining is already showing degradation: the Oil Products Distribution Company has noted falling octane quality from North Refineries Company and a drop in flash point for diesel.
That is not a forward curve I have seen anyone price.
The benchmark broke. Then the OTC market followed.
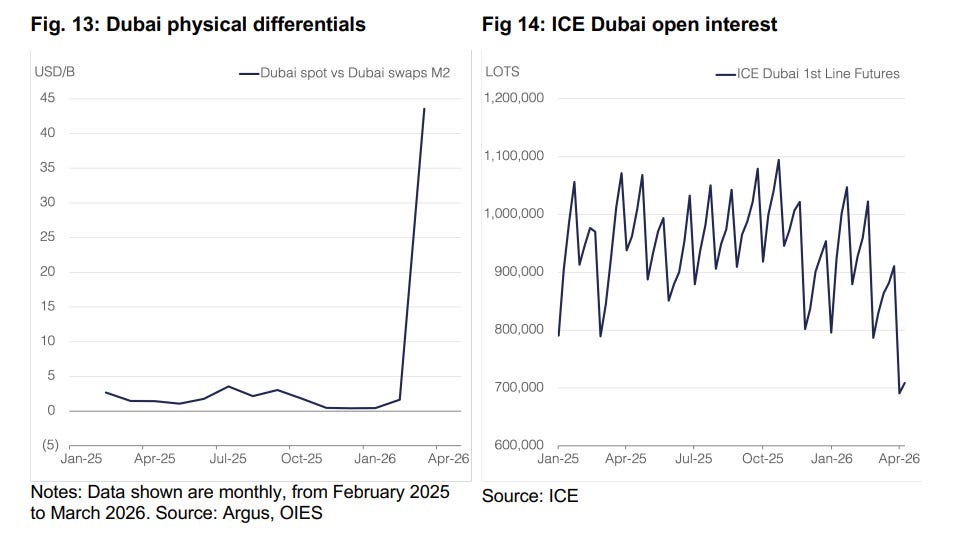
Dubai physical differentials — the spread between Dubai spot assessments and Dubai swaps — moved from a normal range of $1 to $2 a barrel to $43 a barrel in March.
The chart goes vertical. There is no other word for the move.
Open interest in ICE Dubai futures collapsed from over a million lots to under 700,000 in the same window. S&P Global Platts announced it would no longer accept seller nominations for certain Middle East grades, including ALS and Upper Zakum, because the assessment process had broken down.
ADNOC cut supplies to its equity lifters — the trading houses providing most of the liquidity to the Dubai market — at the moment the market most needed them.
A pricing benchmark works for one reason and one reason only:
The assessor can verify that the price reflects an actual transaction in an actual physical barrel. When the physical barrels stop moving, the benchmark stops working.
When ALS cargoes cannot load and Upper Zakum cargoes are stranded, Platts does not have anything to assess. When the equity lifters who provide normal market-on-close liquidity have their volumes cut, the residual liquidity is concentrated in players whose pricing power becomes pathological.
This is not a technical issue.
This is the central nervous system of Middle East crude pricing seizing up at the moment of maximum stress.
Then the OTC market followed.
Dealer hedging amplified the upward move. Momentum trading layered on top.
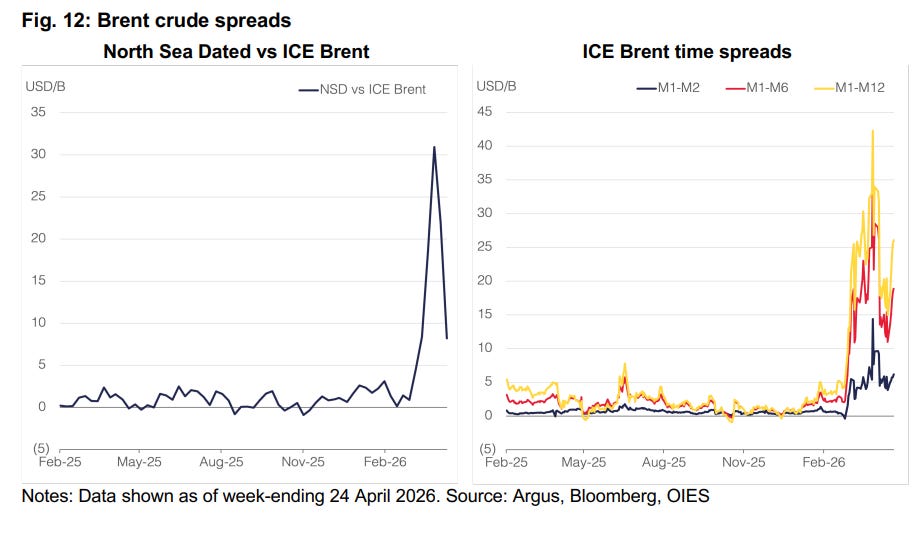
The Dated Brent premium to front-month ICE Brent traded above $30 a barrel in the second week of April.
Historical normal: $1 to $2.
A $30 premium is the market saying the futures curve has lost the ability to price physical scarcity. ICE Brent time spreads moved into extreme backwardation across the curve.
The casualties show up in places the consensus is not looking.
East of Suez OTC swap players who run paper-short, physical-long structures as their normal mode of operation — Asian refiners hedging procurement, traders running term-against-spot books — took massive losses when their physical legs evaporated under the chokepoint disruption while their paper legs continued to mark to a market that had decoupled from physical reality.
Several closed financial positions at fire-sale prices.
Asian refiners have asked Saudi Aramco to change the OSP pricing methodology because the Dubai benchmark on which it is based is no longer producing reliable signals. The April trade cycle has seen a quiet but significant migration of OTC pricing in Asia from Dubai to Dated Brent.
Twenty years of effort to build a Middle East-priced, Asia-oriented crude pricing system is being unwound under stress, in real time, by the failure of a single benchmark to function during disruption.
The Murban contract launched in 2021 was supposed to be the answer to exactly this kind of fragility. It is not yet liquid enough to substitute for Dubai.
By the time the war ends, it may be the dominant Middle East benchmark by default — because Dubai will have lost the trust of its users.
That is a reflexive collapse.
The kind that does not unwind when the war ends.
Each player solving their own problem
The walkthrough Fattouh and Economou give of national strategic responses occupies seven pages of the paper. The one-line summary worth carrying forward is this: every player is currently making locally rational decisions that aggregate to global incoherence.
The US has discovered the limits of its energy dominance doctrine.
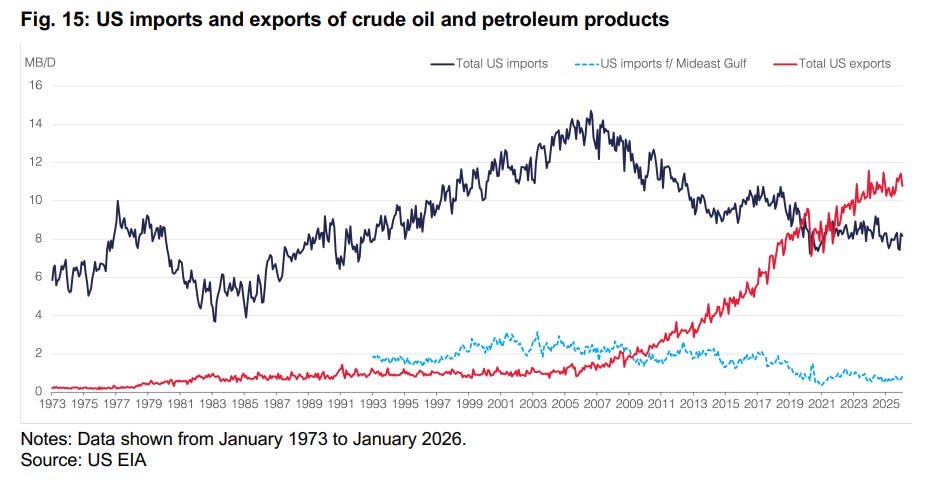
Crude exports are at record highs. WTI Midland is trading at a structural premium in Europe. US Gulf Coast refiners are capturing windfall margins from access to cheaper domestic crude. May exports could reach 5 mb/d, an all-time high.
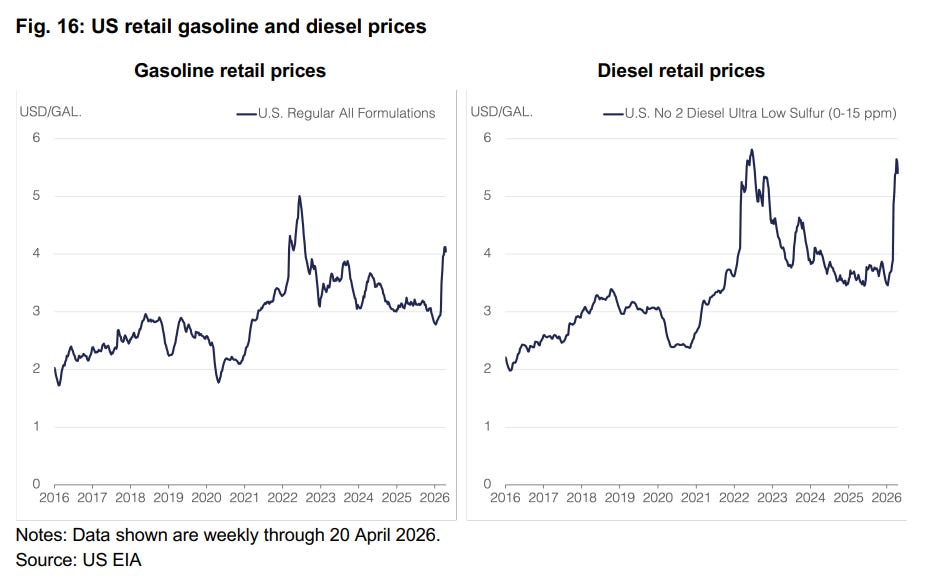
And yet. Gasoline prices above $4 a gallon.
Inflation at 3.3 percent in March against a pre-war forecast of 2.5.
The rig count flat against December — 529 in March versus 528 — despite the administration urging producers to drill.
The doctrine that energy abundance translates into geopolitical leverage and consumer insulation has not survived contact with a real shock.
The US can export more.
It cannot insulate itself from prices.
It cannot force its own producers to invest faster.
Each policy tool — sanctions waivers, SPR releases, Jones Act suspensions — gets reached for, generates short-term relief, gets undone within weeks.
Iran has formalised its control over the Strait.
A tolling system.
An inspection regime. A multi-tier passage protocol where vessels with friendly bilateral arrangements pass for free, neutral vessels pay a fee — payable in rial or cryptocurrency, not dollars — and hostile vessels do not pass at all.
The framework Iran is constructing for the Strait does not contemplate a return to the pre-war “safe and toll-free” passage codified in UNSC Resolution 2817.
It contemplates a permanent regime in which Iran is the gatekeeper.
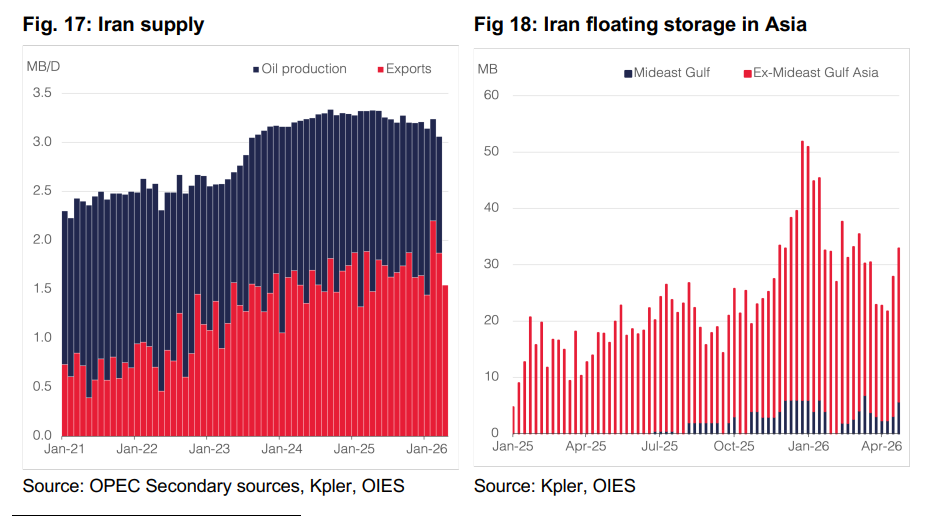
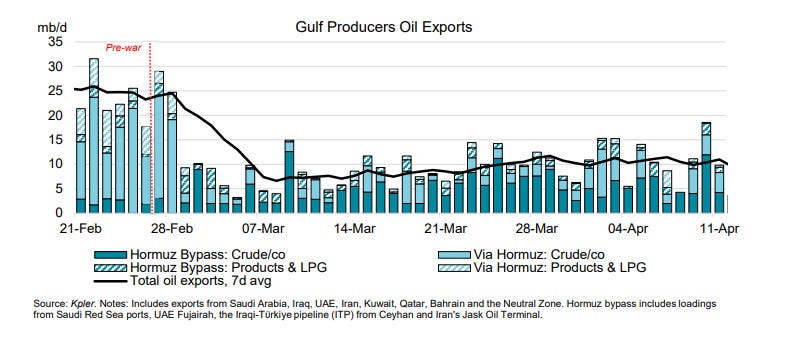
The US blockade since 13 April has reduced Iran’s leverage at the cost of choking its own exports.
The economic price Iran is paying — onshore stocks at forty-nine million barrels, retired tankers brought back to provide fifteen million additional barrels of floating storage, loadings down by seventy-three percent — has not produced any indication that Tehran will give up the negotiating position.
Quite the reverse.
The Iranian counterproposal currently in front of Washington asks for blockade relief in exchange for Strait reopening, with the nuclear question deferred.
That is not a concession.
It is Tehran demanding that Washington pay Tehran’s price to unwind a status quo Tehran imposed.
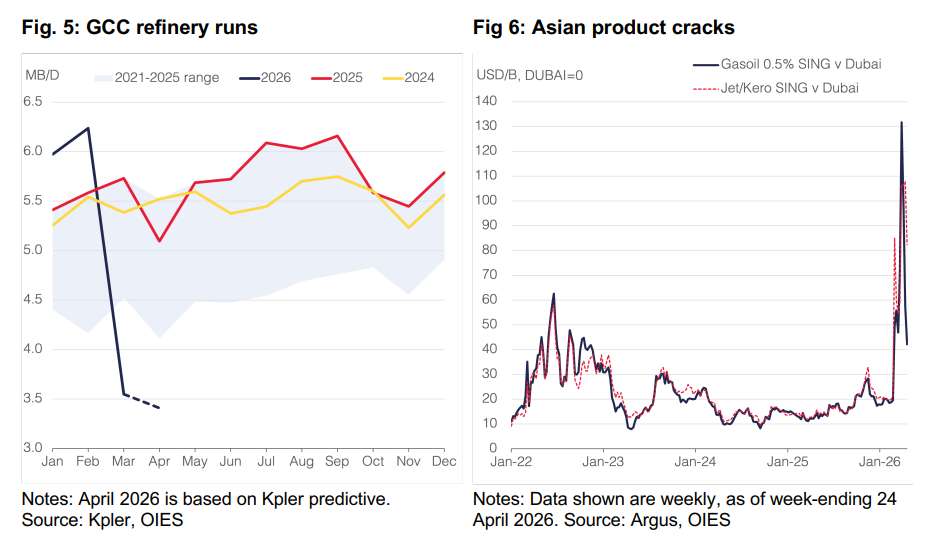
The GCC has been left holding strategic damage that will define its energy posture for the next decade.
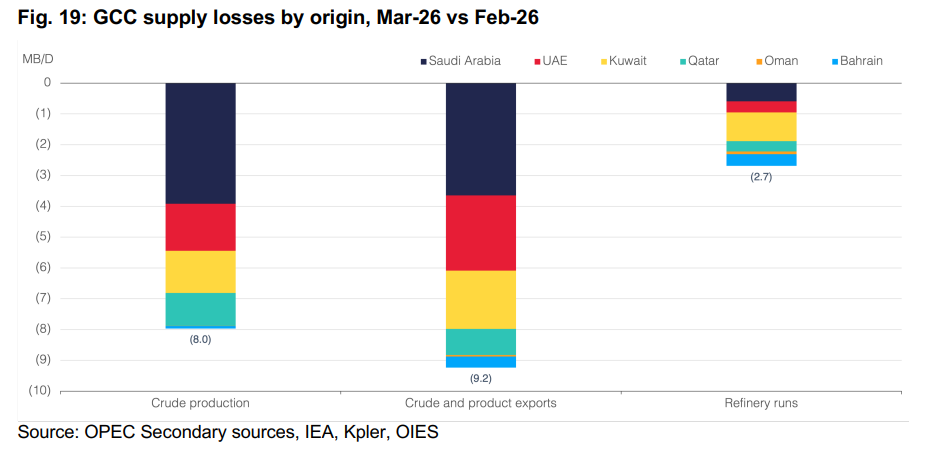
Crude production down forty-two percent month-on-month.
Crude and product exports down forty-eight percent.
Refining runs down forty-three percent.
The IMF revised down GCC growth by 2.3 percentage points in April.

Russia has been the accidental beneficiary of the entire episode.
Crude trading at a premium for the first time since the start of the Ukraine war. Indian buyers returning in size after the late-2025 sanctions on Rosneft and Lukoil. Treasury waivers granted on sanctioned oil at sea, then extended.
Bloomberg reports oil export earnings at the highest levels since June 2022. Ukraine has responded with intensified attacks on Russian energy infrastructure to prevent Russia from converting the windfall into renewed warfighting capacity.
The constraint on Russian benefit is the Ukrainian drone fleet, not Western policy.
China has been better positioned than any other major importer.
Not by accident.
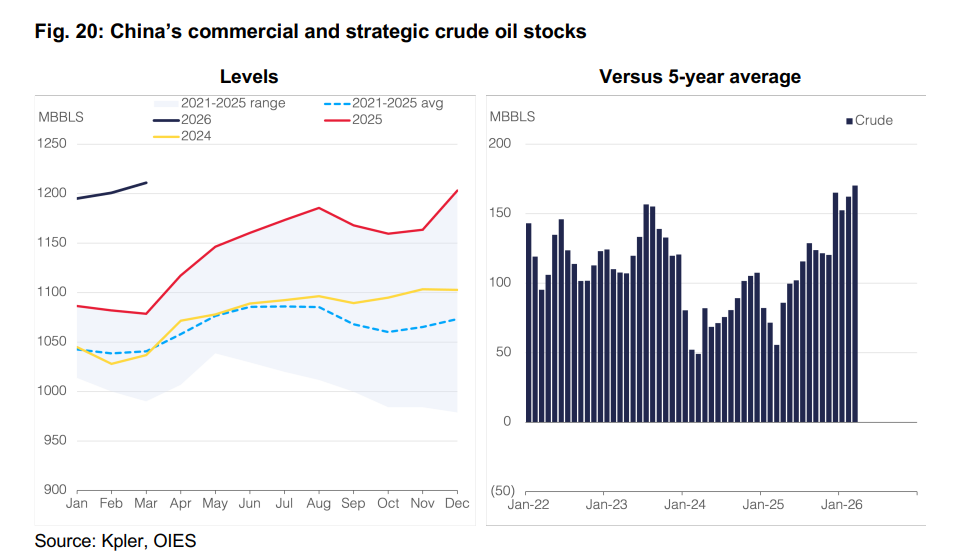
Beijing accumulated 132.5 million barrels of crude inventory between March 2025 and March 2026 — a deliberate strategic build-up that gave China a buffer no other large consumer enjoyed when the war began. Iranian floating storage off the Chinese coast — 38 to 46 million barrels at various points — provides additional cushion. Independent refiners in Shandong have continued sourcing discounted Iranian barrels even under blockade.
Beijing has banned product exports and is reportedly allowing state-owned refiners to draw on commercial inventories.
But the buffer is finite.
Imports from Saudi Arabia are set to halve in May, from forty to twenty million barrels. Petrochemical producers are idling capacity as feedstock costs spike.
Three years of factory deflation in China ended this March under the energy cost shock.
The strategic question is whether China uses its leverage with Iran.
Beijing has so far confined itself to rhetorical objections and bilateral safe-passage arrangements for individual vessels. The blockade is testing whether that posture is sustainable.
Asia ex-China is in the eye of the shock
South Korean refining throughput down.
Japan’s petrochemical industry running at record-low utilisation.
Indian refiners substituting US, Latin American, and West African crude for Middle East barrels at a heavy efficiency penalty — lighter slates produce less middle distillate and less VGO, exactly the products in shortest supply. Asian crude imports falling twenty-two percent year-on-year in April to a ten-year low. Asian refining runs down 2.7 mb/d to 29.4 mb/d in March, with further cuts to 28.5 mb/d in May. Middle distillate output loss across Asia on the order of 1 mb/d.
This is the demand destruction the OIES paper expects to do most of the market-clearing work.
Europe is the spectator
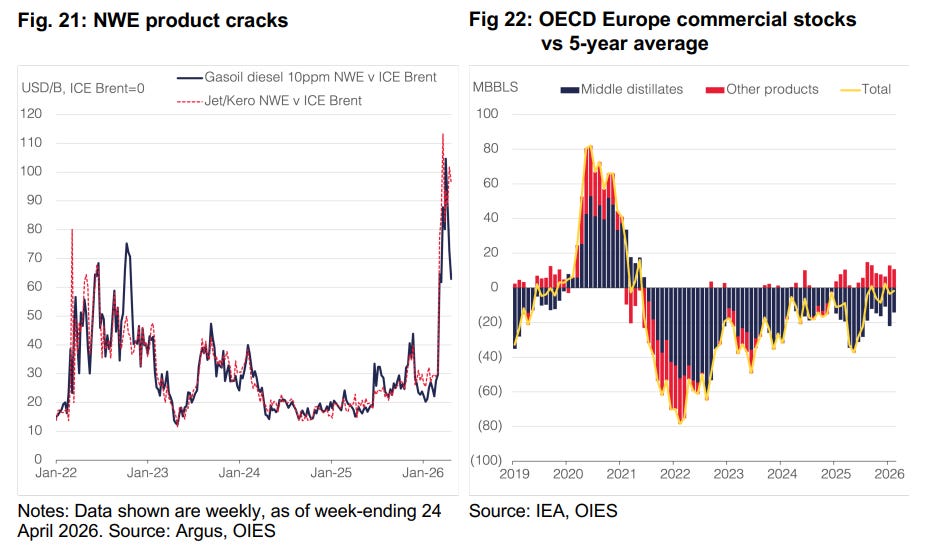
Limited direct exposure to Hormuz flows.
Larger exposure to product imports — particularly diesel and jet — from the GCC. Premiums on medium sour crudes like Norway’s Johan Sverdrup at record levels. NWE diesel cracks above $110 a barrel.
The European Commission has asked member states to consider voluntary demand-saving measures in transport. The EU has rejected military involvement and is pursuing a “multilateral and purely defensive mission” to secure shipping.
Brussels watches.
Brussels issues statements.
Brussels convenes coalitions.
Brussels does not move oil.
The aggregation problem is the part nobody is saying out loud.
The US is using the tools available to a hegemon
Iran is using the leverage available to a chokepoint controller.
The GCC is preserving optionality. Russia is converting a sanctions episode into a windfall. China is drawing down its buffers.
Asia is destroying demand. Europe is watching.
Each strategy makes sense in isolation.
None of them produces a path that returns the system to coordinated supply management.
OPEC+ cohesion was the coordination mechanism for the last decade.
The pre-war oil market had a single clearing mechanism.
The post-war oil market may not have one at all.
What the tape is telling you, and what it is not
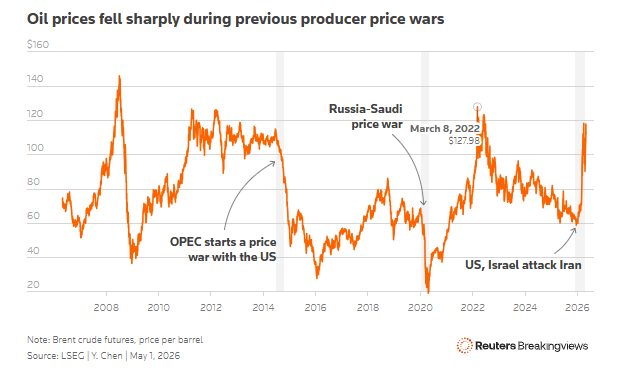
Brent settled above $111 a barrel on Friday for a second consecutive weekly gain.
The intraday print on Thursday touched $114, the highest since June 2022.
WTI sat above $105 and is up roughly seventy-three percent year-on-year.
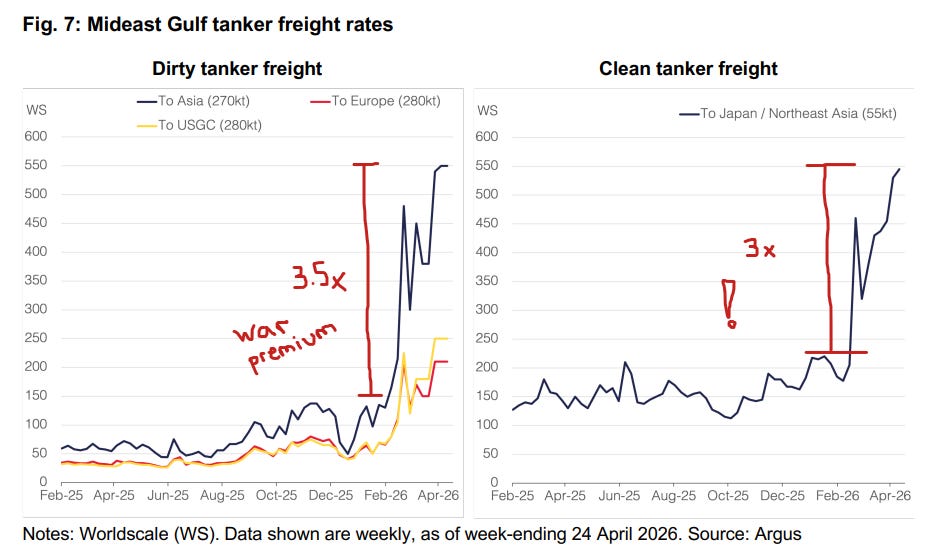
The Middle East-to-Asia tanker rate index — Worldscale 56.5 in early February — printed above WS 500 in mid-April. Asian jet fuel cracks against Dubai north of $130 a barrel.
That is the surface of the tape.
Underneath it is everything the OIES paper documents.
The UAE formally left OPEC and OPEC+ on Friday, effective 1 May.
ADNOC chief Sultan Al-Jaber framed it as a sovereign national decision timed precisely because the Strait closure means the immediate market impact is muted.
JPMorgan analysts read it as an erosion of OPEC+ discipline.
Saxo Bank’s Ole Hansen said the UAE had “seized the opportunity to exit OPEC, removing the production quota straitjacket that for years frustrated the oil-rich nation.”
Rystad’s geopolitics head called it “a real tool out of the group’s hands.”
The Trump administration declared the war “terminated” on Thursday afternoon.
Roger Wicker, the Republican committee chair, has been “not too concerned” about the deadline. Tim Kaine called Hegseth’s interpretation “novel” and lacking legal support. Bruce Fein, a US constitutional law expert, told Al Jazeera the resolution “never says anywhere” the deadline pauses if there is a ceasefire.
CENTCOM commander Admiral Brad Cooper has reportedly briefed Trump on a plan for a “short and powerful” wave of strikes intended to break the blockade-versus-counter-blockade deadlock. Other options include a special forces operation to secure Iranian highly-enriched uranium, and “actions to gain more US control over the strait.”
Read these against the OIES framework.
The 60-day clock has expired without congressional authorisation.
The executive branch is asserting an interpretation of statute with no textual basis.
The legislative branch is divided along lines that do not produce a binding constraint. The military is preparing a kinetic option that does not require congressional approval. The Iranian negotiating position has shifted toward terms that prolong rather than resolve the chokepoint issue.
The probability that the Strait of Hormuz returns to “safe and toll-free freedom of navigation” within the 2026 horizon has fallen, not risen, over the two months of ceasefire.
The market is trading $111 Brent on the assumption that something resolves at midyear. The OIES paper, the Hegseth testimony, the UAE exit, the CENTCOM strike plan, and the Iranian negotiating position are all telling you that midyear resolution is the upside scenario, not the central one.
What the curve is not pricing
The OIES paper is not a trading note.
This article is closer to one.
The structural break in Middle East crude pricing is the durable trade.
The Dubai benchmark broke in March. Murban is not yet liquid enough to substitute. The OTC migration toward Dated Brent is happening in real time.
First-order effect: a wider Brent-Dubai spread for as long as the Strait remains restricted.
Second-order effect: a permanent shift in how Asian refiners price Middle East crude — a shift that outlasts the war regardless of when the war ends. Stress-tested infrastructure that fails the test does not get rehired afterward.
This is the position that survives every scenario in the OIES paper.
The middle distillate gap is a 2026 story, not a Q2 story.
Asian refining cuts of 2 mb/d quoted in IEA April are forecast to deepen further into May. Middle East crude produces roughly sixty percent middle distillates. Substitute light sweet barrels produce around forty percent.
The 1 mb/d middle distillate output loss the FGE estimate cited in the OIES paper, multiplied across the full duration of the disruption, is closer to 100 to 150 million barrels of cumulative diesel and jet shortfall by year-end.
NWE diesel cracks at $110 and Asian jet cracks at $130 are not the peak.
The peak comes later, when European stocks deplete into Q3 ahead of an unreplenished refinery run rate.
The 60-day War Powers expiration removed a constraint on US escalation.
This is the part that is not widely understood outside Washington.
The Hegseth interpretation that the ceasefire pauses the clock is legally unsupported but politically operative — Republican senators have signalled they will accept it, the administration has formalised the position, and the binding constraint on continued military operations has effectively been removed. CENTCOM’s “short and powerful” strike plan is now an executive option that does not require congressional authorisation.
The probability of a renewed kinetic phase before midyear has gone up, not down, with the expiration of 1 May. The market is reading the ceasefire as de-escalation. The mechanical reality is that the legal infrastructure that would have constrained re-escalation has just been disabled.
The UAE OPEC exit is a 2027 event the 2026 strip is not pricing.
Immediate market impact muted, as Hansen and Al-Jaber both noted, because UAE production is constrained by the Strait, not by quota.
Medium-term implication, when the Strait normalises: 1.6 mb/d of UAE spare capacity becomes available on its own terms, not within an OPEC framework.
A structural negative for prices in the eventual normalisation scenario. A shadow OPEC unwind that lurks underneath every resolution path. For anyone trading the 2027 Brent strip, the exit matters even though the May tape does not show it.
The room
I want to come back to the chart I started with.
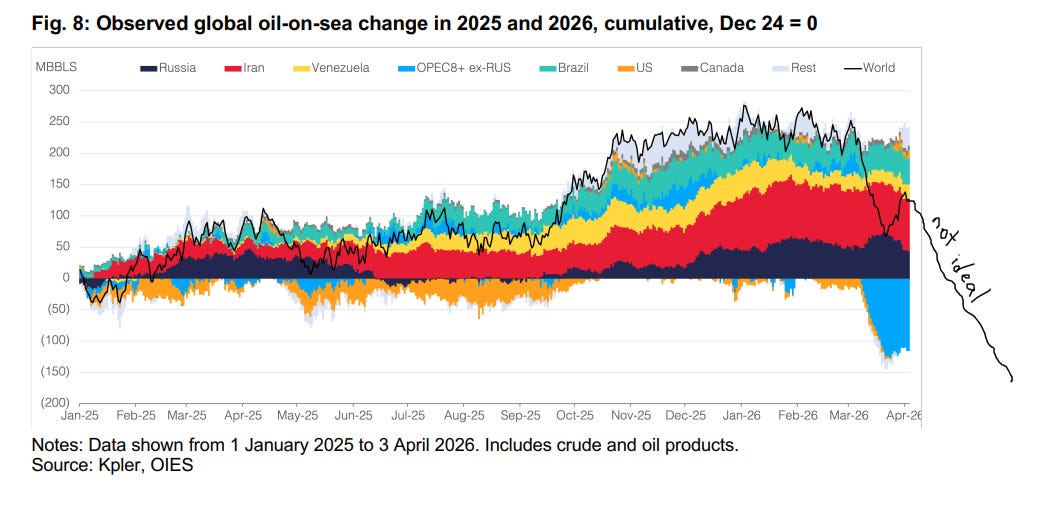
A hundred million barrels of inventory drawn from the global system in a single month, masking a 200-million-barrel draw from the world outside the Middle East paired with a 110-million-barrel build inside the Middle East.
Two opposite movements coexisting because the system is no longer a single integrated market. It is two markets, separated by a chokepoint, communicating only through the price level on the screen.
The pre-war oil market had a buffer.
The post-war oil market has a stranded volume — barrels piled up in the wrong place, draining the system everywhere else, with no mechanism to redistribute them.
That is the regime change Fattouh and Economou wrote down.
Every adjustment mechanism in the global oil market — the resilience the system demonstrated through the Russia-Ukraine episode, through COVID, through the 2014 Saudi market-share war, through Abqaiq — has been simultaneously stressed.
Not stressed serially.
Stressed at the same time.
A system can survive the failure of any one of its buffers. It rebuilds the missing buffer using the others. What it cannot survive is the failure of all of them at once.
The pre-war oil market priced uncertainty and mean-reversion.
The post-war oil market is pricing fragmentation and path dependence.
The first one had an equilibrium. The second one does not.
The buffer was in the same room as the breakage.
That is the sentence the desk did not teach you.
Wow. Fantastic piece. Thank you.
Great piece, in depth and holistic perspective!