
The Currie Doctrine
A love letter to Jeff Currie's framework and a eulogy for the oil strip that gave up on time value, risk premiums, and basic thermodynamics

“If something cannot go on forever, it will stop.”
- Herbert Stein’s Law
Welcome to the most expensive psychology experiment in commodity market history. The oil forward curve has achieved something remarkable: complete philosophical surrender. West Texas Intermediate at $64.40 for October 2025, drifting with existential exhaustion to $61.69 by February 2036, represents not a bearish view but the market's declaration that modeling the future is above its pay grade.
This isn't price discovery—it's price abdication. The market has essentially priced oil at $64 forever, despite the minor detail that we're currently pricing it below the cost to produce it. When a market prices impossibilities, betting on possibility isn't speculation—it's arithmetic.
What follows is a systematic application of Jeff Currie's three decades of commodity wisdom to today's energy dystopia. His framework, crystallized in Goldman's work on commodity fundamentals, provides the roadmap through this market psychosis. Every principle is flashing red, screaming that this isn't just wrong—it's historically, catastrophically, career-definingly wrong.
Part I: The Currie Framework: The Curve That Forgot How to Curve
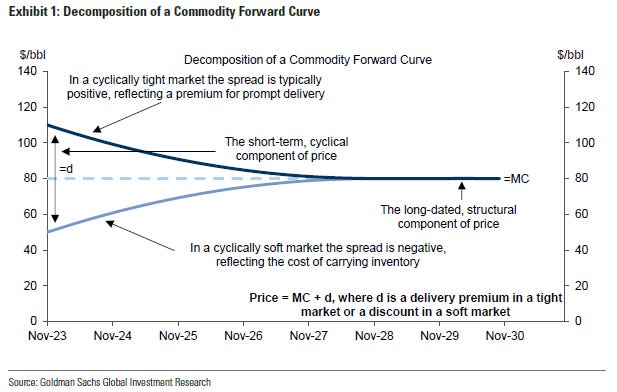
Jeffrey Currie's fundamental decomposition (Price = MC + d) reveals the mathematical impossibility of current pricing. In commodity market theory, convenience yield represents the premium for immediate access to physical supply. Today's configuration shows October 2025 WTI trading at $64.40 against marginal production costs in the Permian Basin, including water disposal and infrastructure, that approach $75-80 per barrel. This implies a convenience yield of negative $10-15.
A persistently negative convenience yield suggests the market believes prompt barrels are worth less than future barrels indefinitely violating fundamental commodity economics. The December 2027 anchor at $62.87 implies production costs will somehow be lower than in 2010, despite the Dallas Fed's Input Cost Index hitting 40.0, its highest reading in years. The cognitive dissonance between physical reality and market pricing has rarely been more pronounced.
The Economics of Paying to Store Worthless Assets
Today's exercise in market nihilism: Oct '25 to Jun '26 shows $1.18 of contango (from $63.36 to $62.18). With storage at $0.50/month and financing at 4.5%, you're paying to hold an asset the market says is permanently impaired. It's financial masochism.
But here's where it gets interesting. The Dallas Fed survey—which I dissected in detail last month—shows 61% of producers would cut at $60. We're at $63. That's not a margin of safety; that's a rounding error from disaster.
The survey's Business Activity Index cratered to -8.1, first negative print since the banking crisis. At these strip prices, U.S. shale isn't just unprofitable—it's volunteering for extinction while the Saudis watch with bemused satisfaction.
Part II: The Architecture of Capitulation
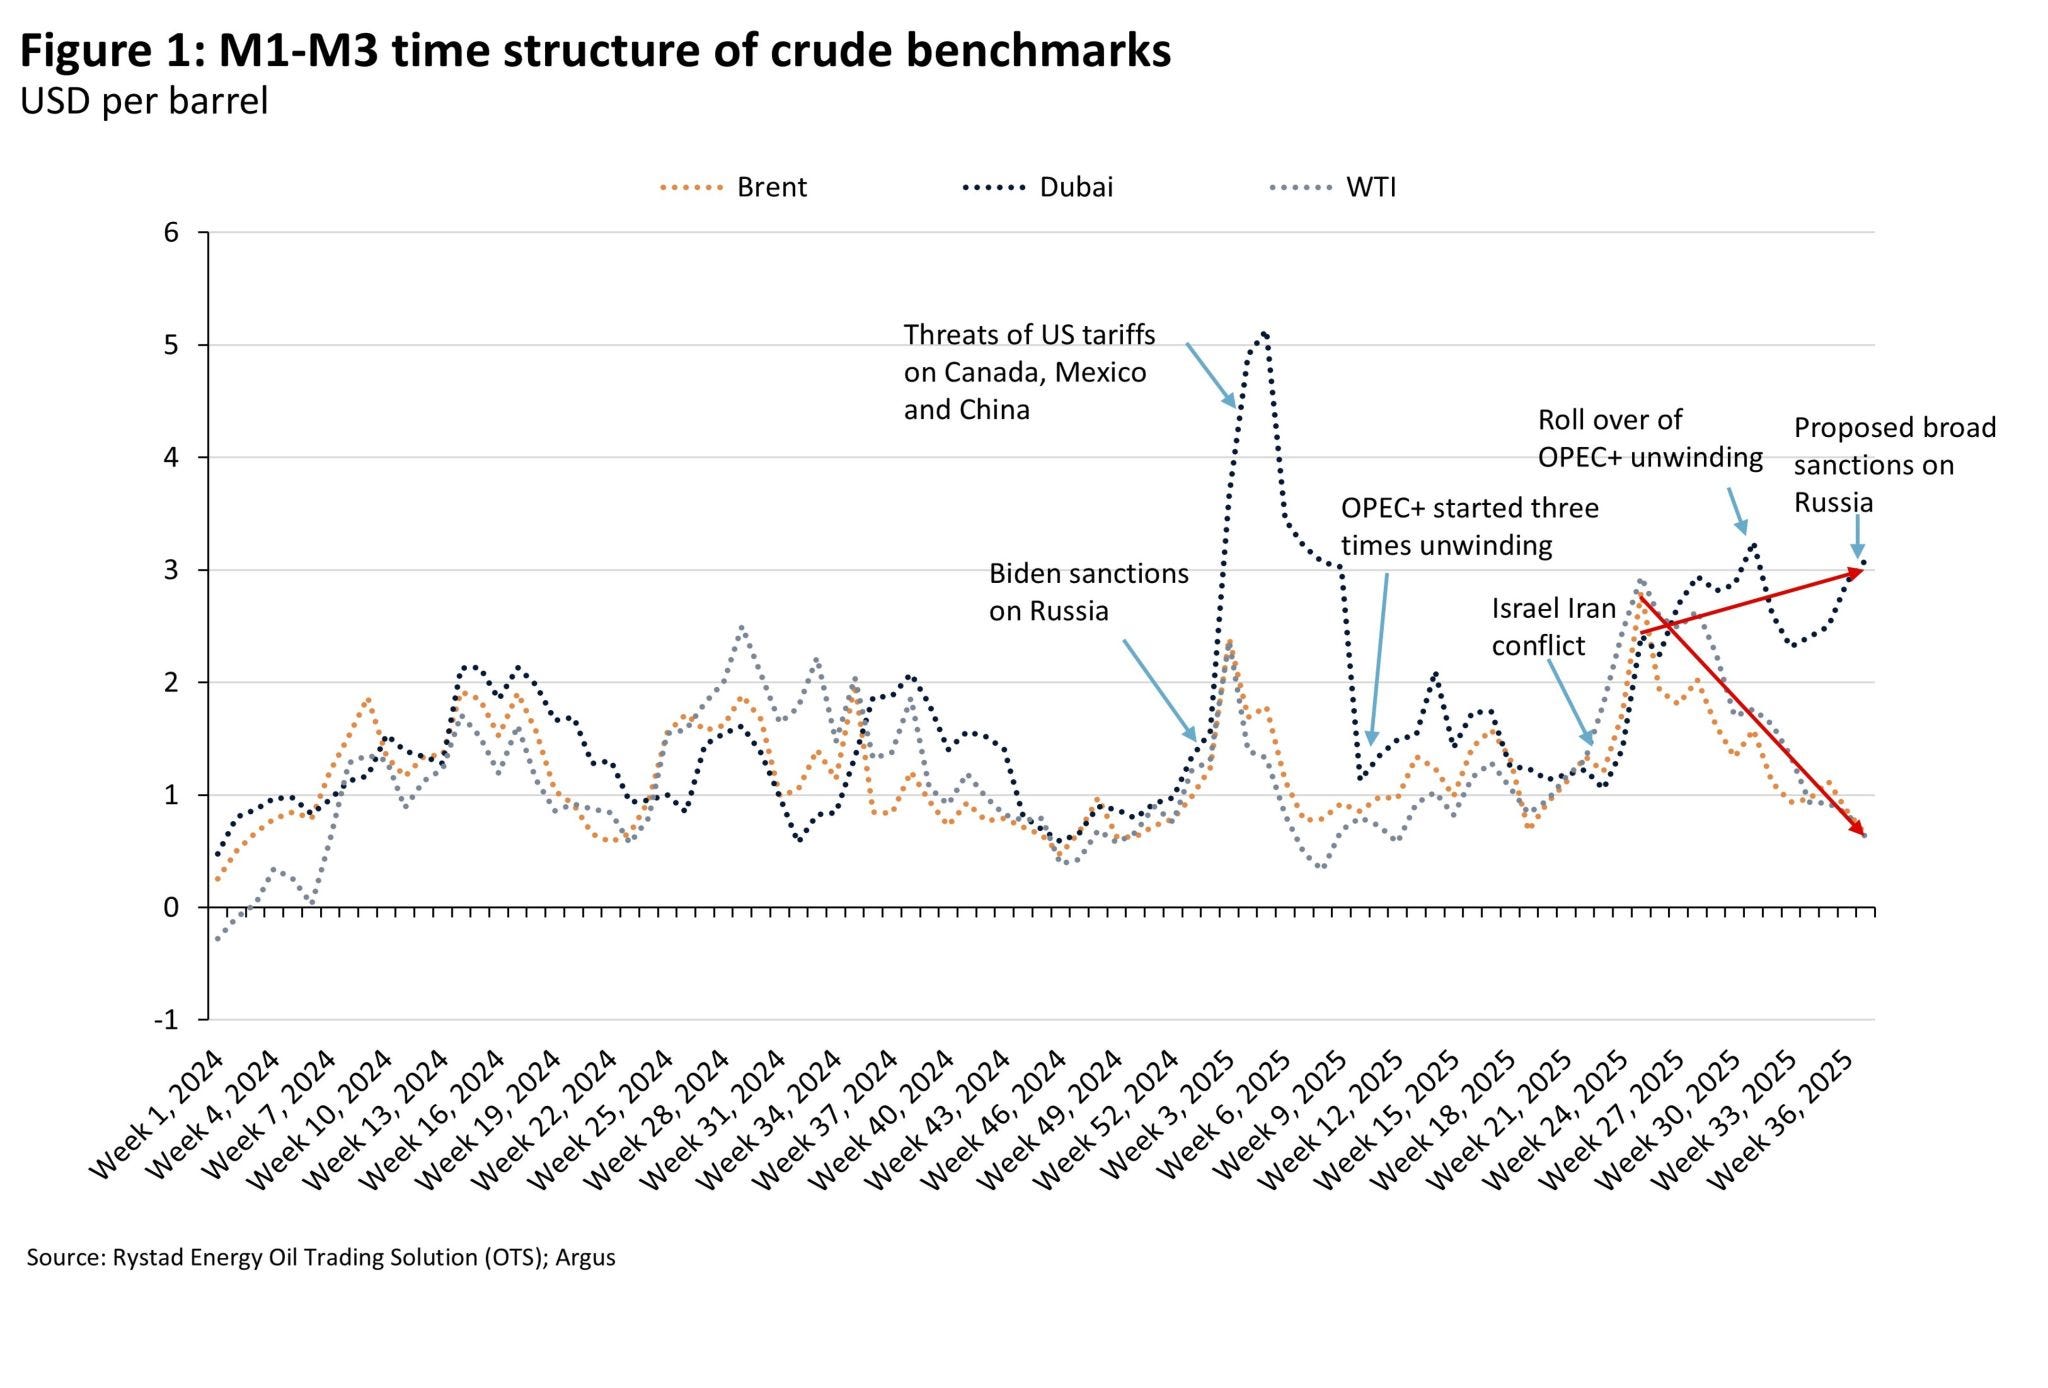
The term structure reveals wholesale surrender in every calendar spread. The October 2025 to December 2026 roll presents the absurdity in stark relief: the front month trades at $64.40 while December 2026 sits at $62.69, creating $1.71 of backwardation. Yet the physical reality of storage presents a different picture entirely. Fourteen months of storage at approximately $0.50 per barrel per month totals $7.00, while financing costs at current rates add another $3.36. The total carry cost of $10.36 means traders are effectively paying over ten dollars to capture negative $1.71. This isn't a carry trade—it's performance art masquerading as market structure.
The liquidity profile across the curve tells an equally revealing story of market abandonment. October 2025 shows 88,355 contracts of open interest, rising to 153,126 for December 2026 before collapsing to just 30,134 by December 2028. By December 2030, only 6,187 contracts remain, and December 2035 shows effectively zero liquidity. This evaporation of participation beyond 2028 means price discovery in the outer years exists in name only—traders attempting to position in these contracts face the prospect of trading against themselves and perhaps two or three algorithmic market makers operating on autopilot.
Part III: Dallas Fed Survey (The Shale Sector's DNR Order)
The Q2 energy survey from the Dallas Federal Reserve provides sobering context for current price levels. The data reveals that 61% of producers would curtail drilling operations at $60 WTI, with mass industry capitulation occurring below that threshold. With the current strip at $64.40 and declining toward the outer years, the market trades within a single adverse OPEC decision of triggering widespread production cuts.
The survey's Business Activity Index plummeted to -8.1, its first negative reading since the regional banking crisis, while input costs surge relentlessly higher. This isn't merely cost inflation—it represents an industry being priced out of economic viability. Water disposal alone now adds $10-15 per barrel to lifting costs in parts of the Permian Basin. At $64 oil, many operators are effectively paying for the privilege of destroying capital.
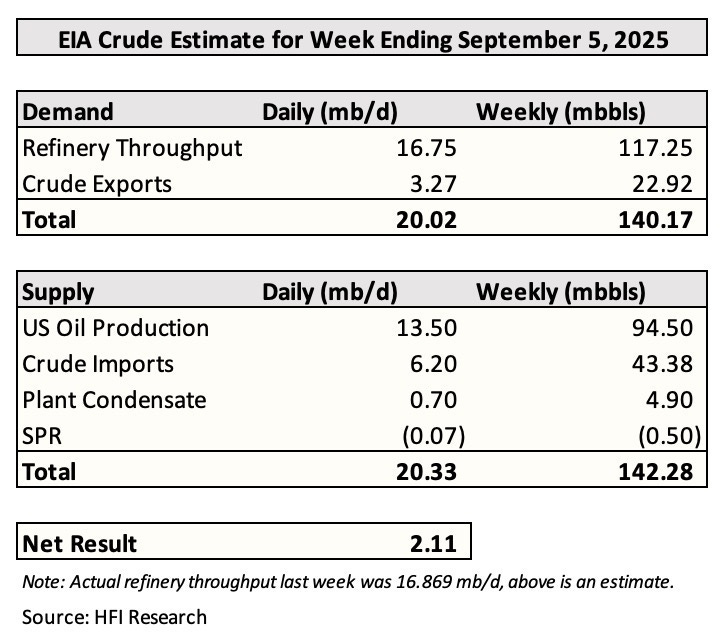
The EIA's own data confirms this reality with U.S. production at 13.50 million barrels per day facing imminent decline without sustained investment capital that these prices cannot support.
Part IV: The Products-Crude Schizophrenia
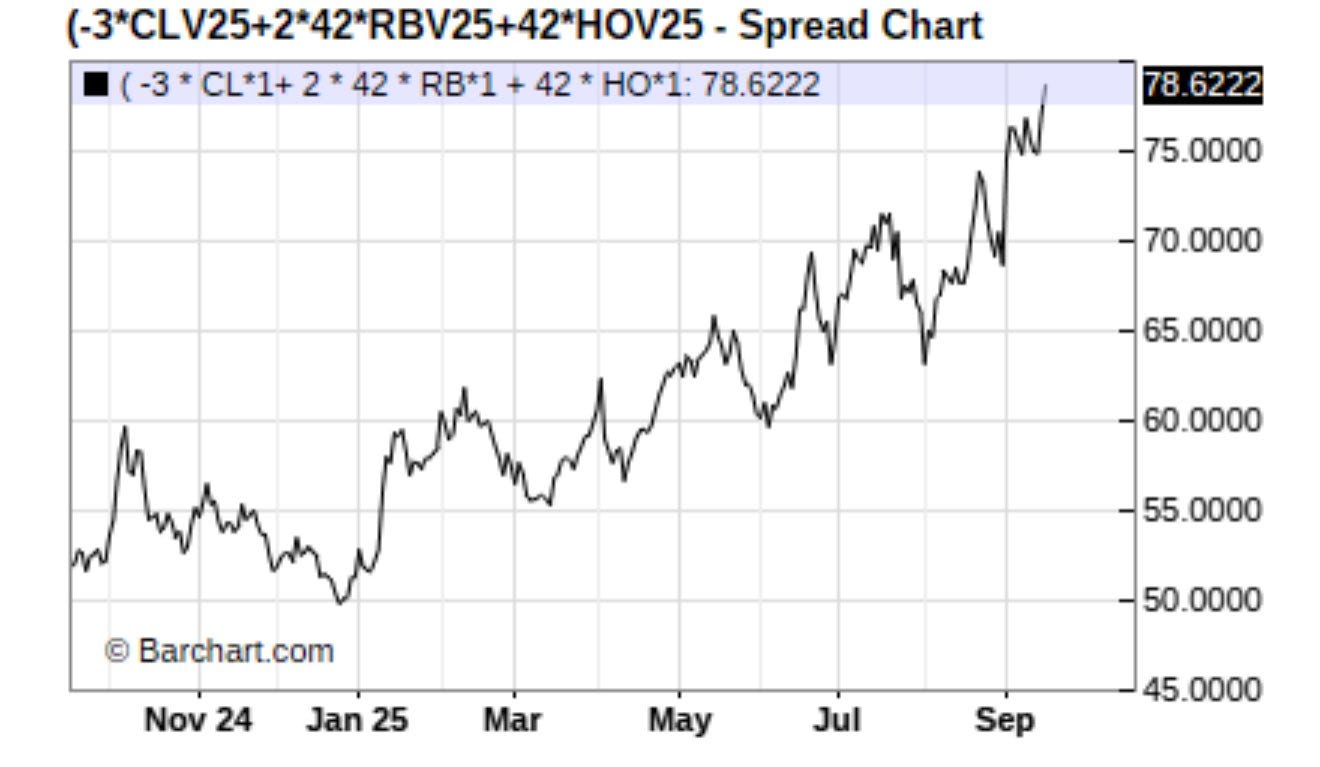
The refined products markets paint an entirely different picture from crude oil, revealing a fundamental disconnect in energy market pricing. RBOB gasoline at $2.0413 per gallon translates to $85.74 per barrel while ULSD diesel at $2.3740 per gallon equals $99.71 per barrel. Against WTI crude at $64.40 per barrel, this creates a gasoline crack spread of $21.34 per barrel and a distillate crack spread of $35.31 per barrel. These aren't the margins of a demand recession—they're the robust spreads of a healthy market showing crack values at $78.62. The products complex sees continuing consumption growth while the crude curve prices permanent oversupply.
History suggests this divergence typically resolves in favor of products prices, as refiners possess more intimate knowledge of actual demand conditions than futures traders staring at screens. The disconnect between physical consumption signals and financial market pricing has rarely been more pronounced.
Part V: BTU Parity Breakdown
Energy equivalence relationships have shattered beyond recognition. Natural gas trading at $3.152 per MMBtu should correlate with oil at approximately $18.91 per barrel on a pure energy content basis. With WTI at $64.40, the current ratio stands at 3.4:1, compared to the historical relationship of 6:1. This isn't mere dislocation—it represents a complete breakdown in energy substitution economics.
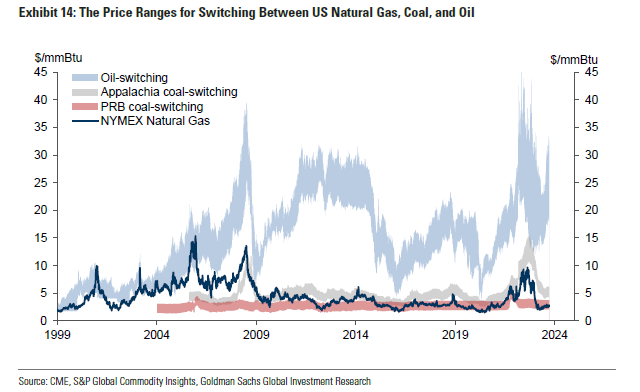
The divergence becomes even more pronounced considering regional variations. European natural gas trades above $10 per MMBtu equivalent while U.S. gas remains stuck at $3, creating massive arbitrage opportunities that should flow through to crude oil pricing. European industrials are literally burning fuel oil instead of natural gas because it's $40 per barrel cheaper on an energy equivalent basis. Yet the oil market remains entirely unresponsive to these signals, as if the laws of thermodynamics have been temporarily suspended.
Part VI: OPEC's Elegant Brutality
Saudi Arabia's strategy reveals itself through the numbers with elegant brutality. Saudi lifting costs remain at approximately $15 per barrel while U.S. shale total costs exceed $75 per barrel. Against current Brent prices at $68.34, the Kingdom operates with comfortable margins while competitors bleed capital. The Saudi fiscal breakeven around $85 provides context for their patience—they can afford to wait while others cannot.
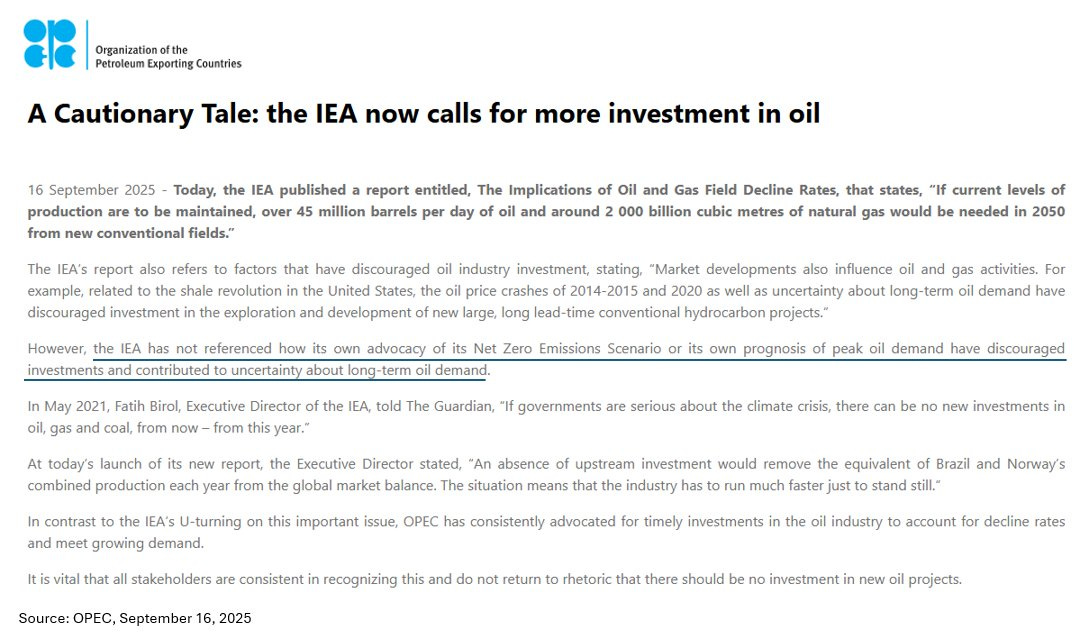
Every month at these prices destroys years of non-OPEC investment capacity. OPEC's own warning about investment needs while maintaining production discipline represents not contradiction but strategy—the methodical elimination of future competition through financial attrition.
Mohammed bin Salman has achieved something remarkable: the systematic destruction of competing supply while maintaining sufficient cash flow for domestic needs. This isn't a price war in the traditional sense—it's economic warfare through patience.
Part VII: Depletion Mathematics
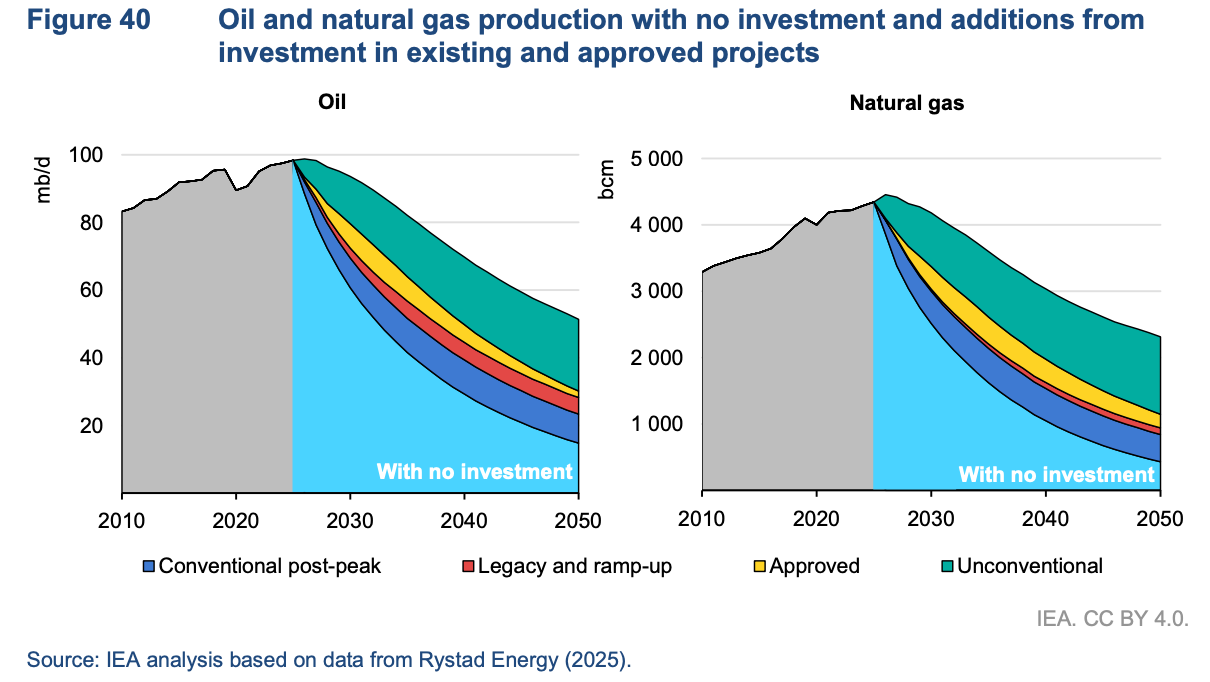
The International Energy Agency's analysis reveals the inexorable mathematics of depletion that the forward curve ignores entirely. Without continuous investment, global oil production declines 8% annually while natural gas production falls 9% per year. The granular data proves even more sobering: small fields decline 11.6% annually, deepwater fields hemorrhage production at 10.3% per year, and even supergiant fields in the Middle East experience 2.7% annual declines.
Maintaining current production through 2050 requires 45 million barrels per day of new oil supply—equivalent to finding four new Saudi Arabias. At current strip prices, the investment capital required has evaporated entirely. The U.S. rig count continues its relentless decline while the inventory of drilled but uncompleted wells has fallen to 5,215—the lowest level since records began in 2013. When these DUCs are exhausted, production doesn't decline gradually—it falls off a cliff.
Part VIII: Historical Precedent
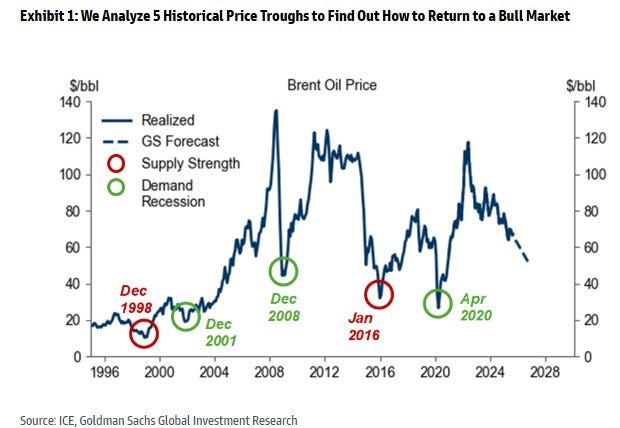
Goldman Sachs' analysis identifies five historical oil market troughs, each followed by explosive recoveries that rewarded patient capital handsomely. December 1998's Asian Financial Crisis trough preceded a 400% recovery. The December 2001 post-9/11 collapse led to a 600% surge. The December 2008 Global Financial Crisis bottom sparked a 200% rally. January 2016's shale bust created a 300% opportunity, and April 2020's COVID collapse generated 400% returns for those who recognized the pattern.
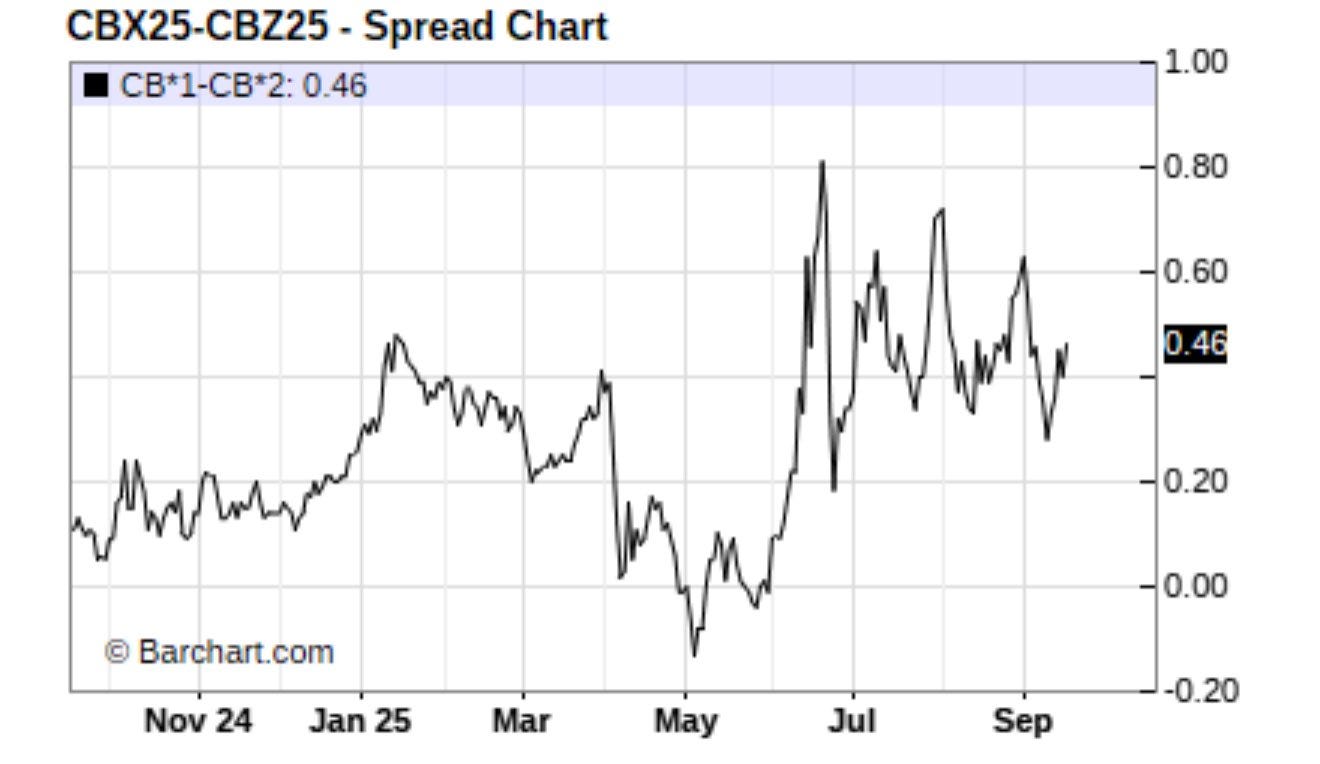
The current market configuration displays all three catalysts Goldman identifies as precursors to major rallies. Forward curves are beginning to regain confidence as time spreads slowly steepen from extremely depressed levels. Supply destruction accelerates with each passing week of sub-$70 prices. Inventories normalize as demand proves more resilient than the doomsters predicted. The pattern suggests not just recovery but potential violence to the upside when the market finally acknowledges physical reality.
Part IX: The Trading Matrix
The opportunities present themselves with unusual clarity for those willing to see them. The calendar spread normalization trade involves establishing long positions in December 2027 at $62.87 against short positions in October 2025 at $64.40. The current $1.53 inversion should transform into at least $10 of normal contango based on storage economics and cost of capital, presenting a risk/reward ratio exceeding 7:1.
Deep curve positioning offers even more asymmetric opportunities. The December 2030 versus December 2026 spread of just $1.04 dramatically underprices the impact of four years of depletion. Historical precedent suggests this spread should exceed $15, creating one of the most asymmetric opportunities in commodity markets for those with the patience to wait for physics to reassert itself.
The BTU convergence trade exploits the breakdown in energy equivalence relationships. Establishing long WTI positions against BTU-weighted short natural gas positions captures the inevitable reconvergence toward historical norms. The current 3.4:1 ratio should move toward at least 5:1, generating substantial returns with limited directional risk.
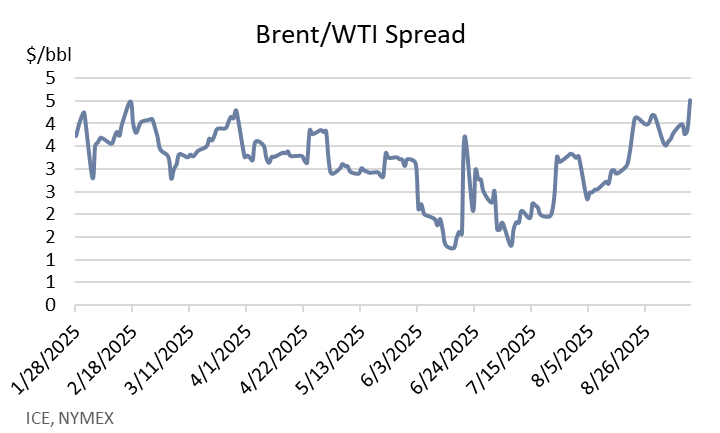
Meanwhile, the Brent-WTI spread at $3.94 exceeds historical norms by nearly 100%, creating a high-probability compression trade as Atlantic Basin arbitrage mechanisms eventually reassert themselves.
Part X: When Markets Forget Physics
The full-term structure reads like capitulation poetry written by exhausted algorithms. Near-term contracts at October 2025 show $64.40 with 88,355 open interest—barely enough liquidity for institutional positioning. Medium-term contracts at December 2027 trade at $62.87 with just 72,599 open interest—a ghost town by commodity standards. Long-term contracts at December 2030 show $63.73 with only 6,187 contracts—essentially a private market.
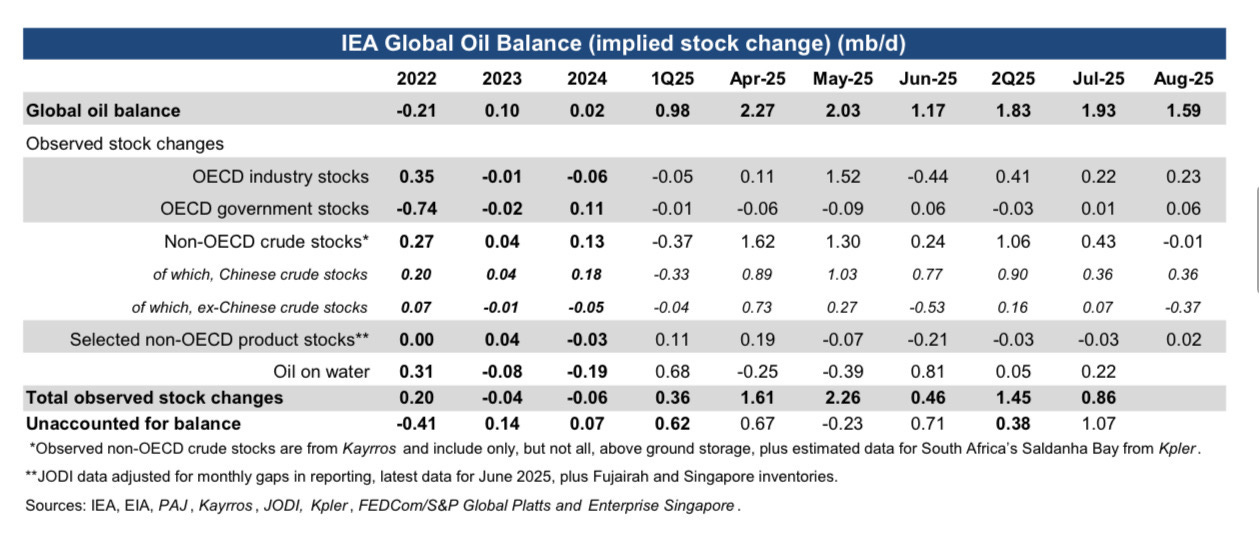
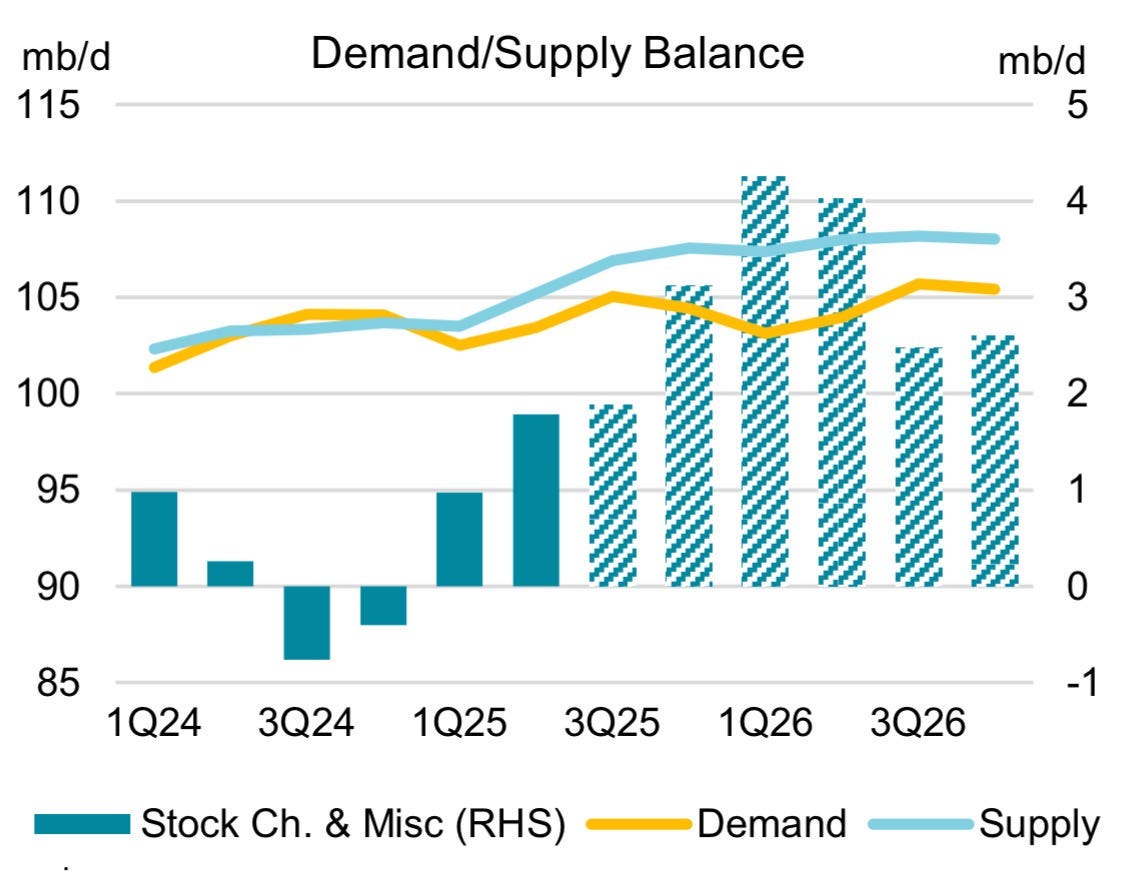
The supply and demand dynamics reveal the contradiction in stark relief. Inventories build through 2025-2026 at over 2 million barrels per day precisely as the market prices permanent depression. The IEA projects continued demand growth while supply struggles to keep pace, yet prices remain comatose. This configuration prices maximum pessimism near-term, capitulation mid-curve, and permanent depression long-term.
Markets don't work this way—until they do, until they don't.
Part XI: The Freight Market Signal
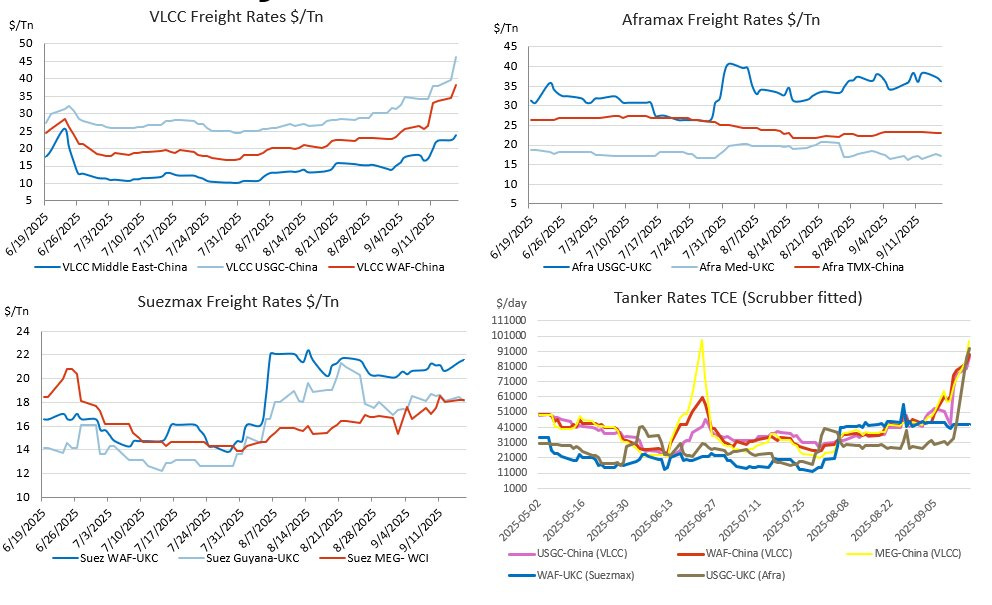
The tanker market tells a dramatically different story from the paper oil market. VLCC rates spike to $45 per tonne while Suezmax rates sustain above $20. Product tankers break higher across all routes. The physical market requires ships, and ship owners don't work for free. When freight rates explode while oil prices flatline, the disconnect reveals itself starkly.
Ship owners profit while oil traders capitulate, suggesting the physical market knows something the paper market refuses to acknowledge. The divergence between transportation costs and commodity prices typically resolves in favor of physical reality. Those moving actual barrels understand supply and demand in ways that screen-watchers often miss.
Part XII: The Investment Cliff
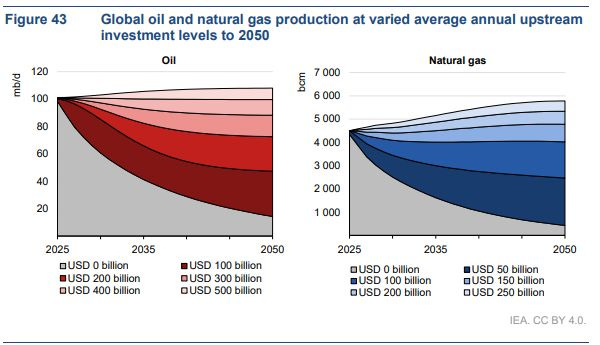
Goldman's investment analysis crystallizes the contradiction between market pricing and physical requirements. With USD 400 billion annual investment, the industry maintains approximately 100 million barrels per day of production through 2050. At USD 200 billion, production collapses to 60 million barrels per day by 2040. The current trajectory, driven by these price levels, heads inexorably toward the lower scenario.

The firm's base case shows OPEC+ production increases through 2025Q4-2026, then tightens post-2026 by systematically discouraging non-OPEC supply through sustained low prices. At $64 forever, we're guaranteeing the lower investment scenario while pretending the upper scenario's production will magically appear. This cognitive dissonance between investment requirements and price signals represents one of the great contradictions in commodity market history.
Part XIII: The Demand Divergence
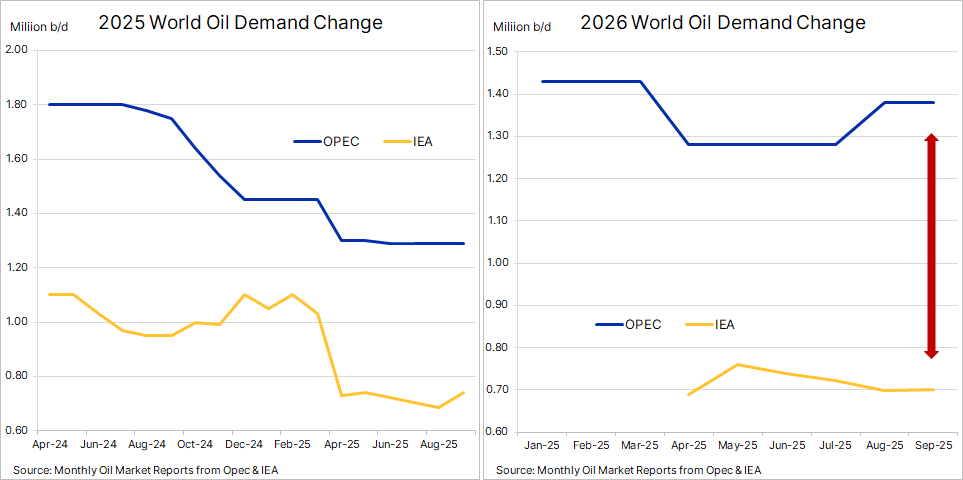
The major forecasting agencies can't even agree on basic demand growth, revealing the uncertainty that plagues current analysis. OPEC projects 1.27 million barrels per day of demand growth for 2025 while the IEA sees only 0.70 million barrels per day. The 2026 divergence grows even wider, with agencies essentially describing different universes of consumption.
Yet both agencies see continued growth while the forward curve prices permanent stagnation. This disconnect between fundamental analysis and market pricing has rarely been more pronounced. When the experts disagree on magnitude but agree on direction, while markets price the opposite direction entirely, opportunity emerges for those willing to trust physics over psychology.
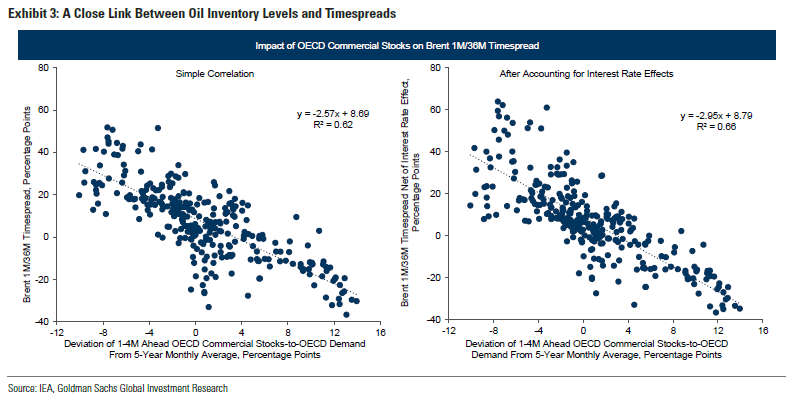
Part XIV: The Inventory Contradiction
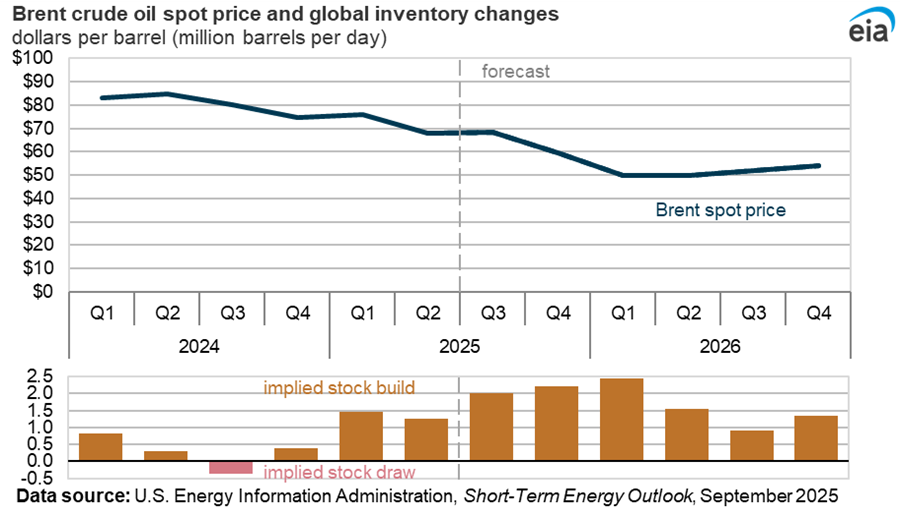
The Energy Information Administration's own forecast reveals the absurdity in government-certified detail. The agency projects inventories building at over 2 million barrels per day through 2025 while simultaneously forecasting prices declining to $50 by 2026. The historical correlation between inventory changes and price movements, one of the most reliable relationships in commodity markets, has completely broken down.
When inventories build while prices fall below marginal cost, something fundamental must give. Either demand collapses, supply disappears, or prices adjust. With demand proving resilient and supply already strained, the path of least resistance points toward violent price adjustment when reality finally intrudes on market fantasy.
The Inevitable Reckoning
The energy market has priced its own thermodynamic death—eternal equilibrium at $64 where nothing changes, nothing matters and tomorrow mirrors today in perpetuity. This represents the ultimate capitulation: not a crash, but abandonment of the very concept that the future might differ from today. Yet commodities don't respond to sentiment—they respond to physics with its BFF called fundamentals. And physics/fundamentals remains undefeated in its historical record against market psychology.
The market has priced permanent $64 oil as if discovering the secret to perpetual motion. The Dallas Fed reveals producers teetering on the edge of mass capitulation. Energy equivalence relationships have shattered beyond recognition. The forward curve has achieved perfect nihilistic flatness that would make a Japanese government bond trader weep with envy.
This configuration doesn't represent a bear market or a bull market—it represents a market that has forgotten what markets do. When universal consensus believes nothing will ever change, everything stands poised to change dramatically and violently. The setup isn't contrarian—it's arithmetic. Goldman's framework isn't just theory—it's prophecy. And right now, it prophesies this forward curve will occupy finance textbooks in chapters titled "What Were They Thinking?"
The trades present themselves obviously: establish long positions in the back end where liquidity has evaporated and mispricing peaks, spread calendars where contango violates basic storage economics, arbitrage BTU relationships that have departed from physical reality. This isn't catching falling knives—it's collecting hundred-dollar bills while others debate whether money still exists. The question facing traders isn't whether this market structure is wrong, but whether they'll be explaining in 2027 how they recognized the opportunity or why they missed it. Because when oil markets forget that producing oil requires capital, remembering that basic fact isn't speculation—it's simply counting.
The forward curve says $64 forever. Forever, as this market is about to discover, is a very long time to be wrong about the laws of physics. Choose your weapons carefully. But whatever you do, don't choose $64 forever. Because physics always wins. And somewhere, Jeff Currie is probably smiling at the beautiful inevitability of it all.